

Local High School Grad Becomes Entrepreneur
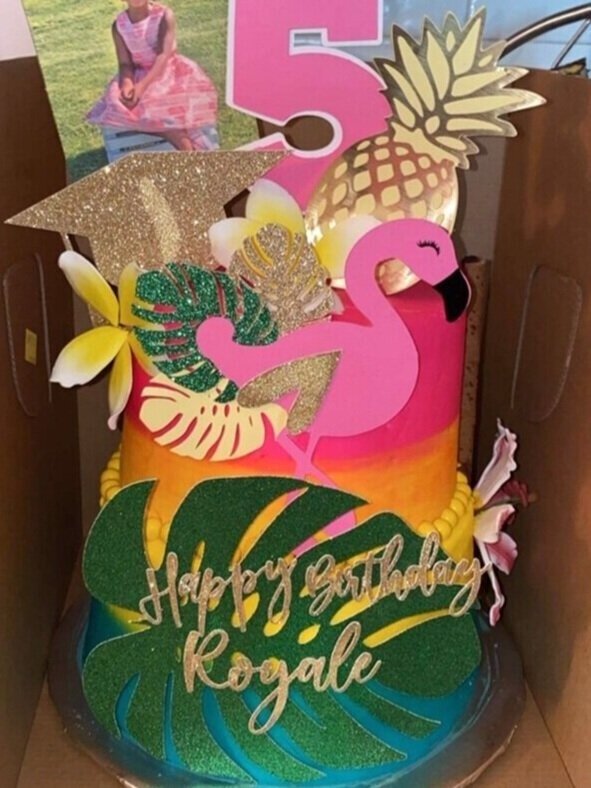
Come learn about and be inspired by the journey of Monique, a local grad, entrepreneur, and co-owner of the Sweets & Things bakery and Yummy Things catering business.

Career Technical Education Classes Sparks Lifelong Passion

Monique Dawes-Jeffers, Pastry Chef
Monique is a lifelong High Desert resident that graduated from Silverado High School.
MONIQUE’S STORY
MONIQUE’S CTE CLASSES AND A PASSION INSTALLED IN HER BY HER FAMILY MOTIVATED her TO START HER OWN BUSINESS. OWNING HER OWN BUSINESS HAS NOT ALWAYS BEEN EASY, BUT MONIQUE’S HARD WORK AND CREATIVITY HAS MADE HER JOURNEY SO REWARDING. MONIQUE’S STORY IS incredibly INSPIRING!
QUESTION: Monique, would you tell us about what you do and how you got to where you are today?
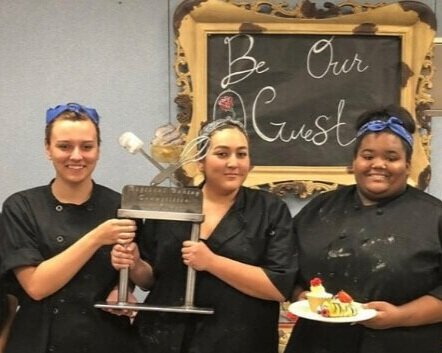
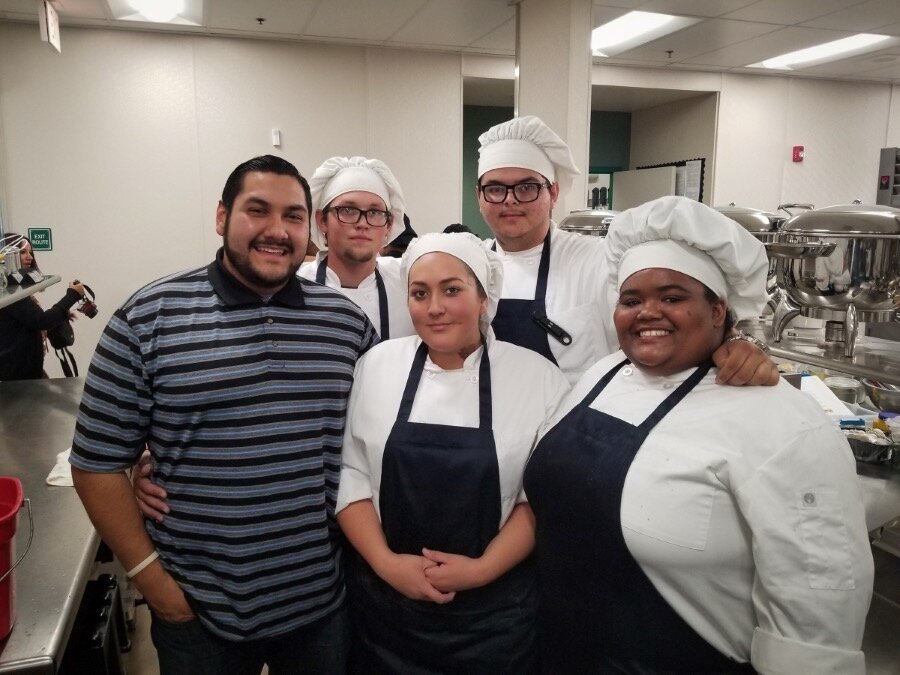
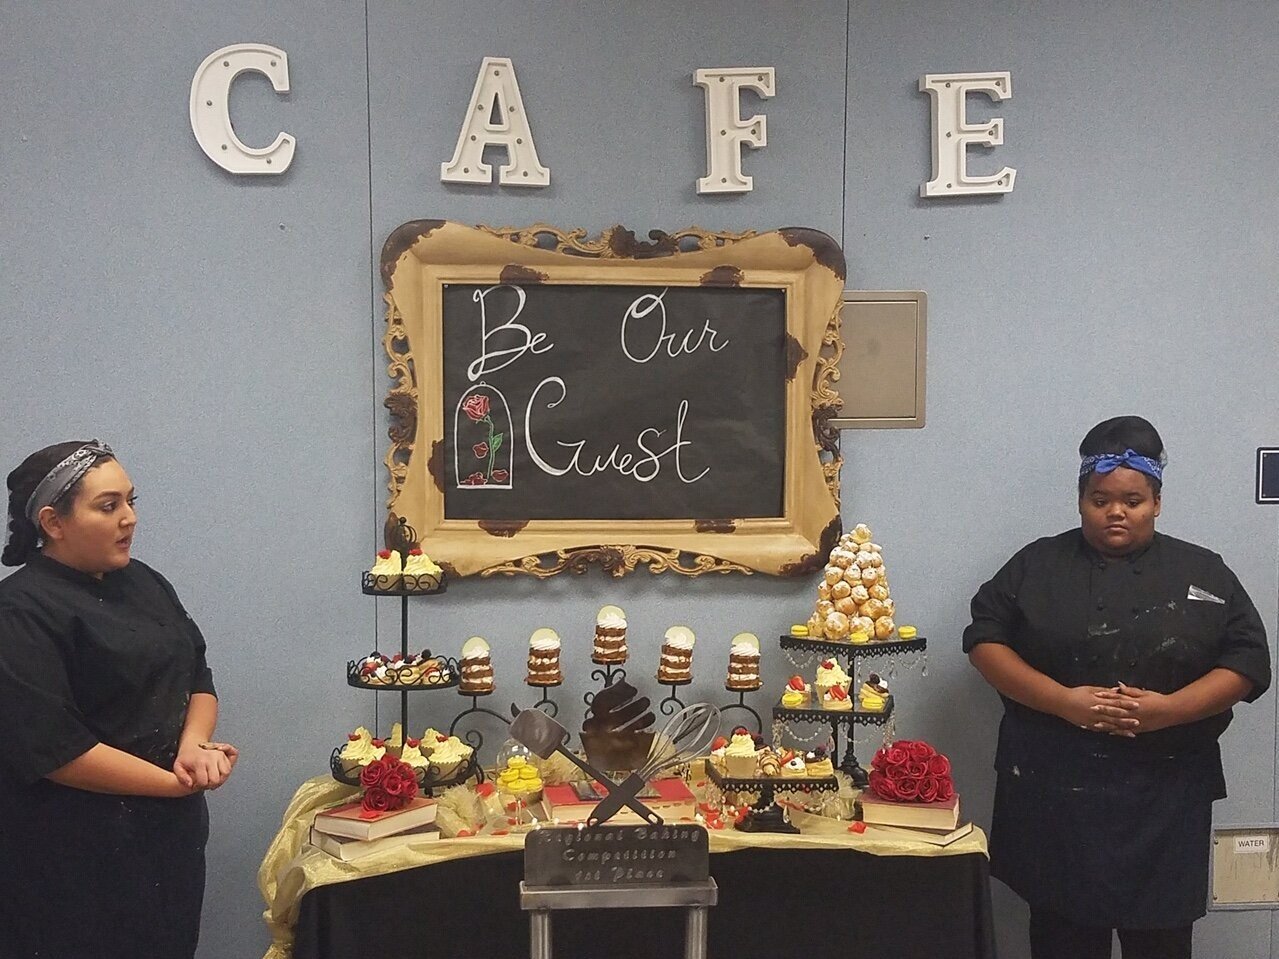
Monique: I am currently the co-owner of a small bakery called Sweets & Things and a catering business called Yummy Things. I can say cooking has always been a family passion that I attribute to my grandfather and mother. They have been teaching me how to bake and cook for as far back as I can remember. While in high school, I took Baking Occupations and Culinary Arts II. I learned so much from my CTE classes, not just about baking and cooking but also about the business side of things. When I became a senior, I competed in the first-ever local Chopped and Sweet Genius competitions, where my team and I took first place in both. I can honestly say that the Baking Occupations and Culinary classes opened my eyes and ultimately sparked my interest in all the possible opportunities that were out there for me. I will be forever grateful for the opportunity to take those classes and for my teacher Mr. Sanchez. Mr. Sanchez will always be my mentor, and he continues to be my sounding board on so many things in my business.
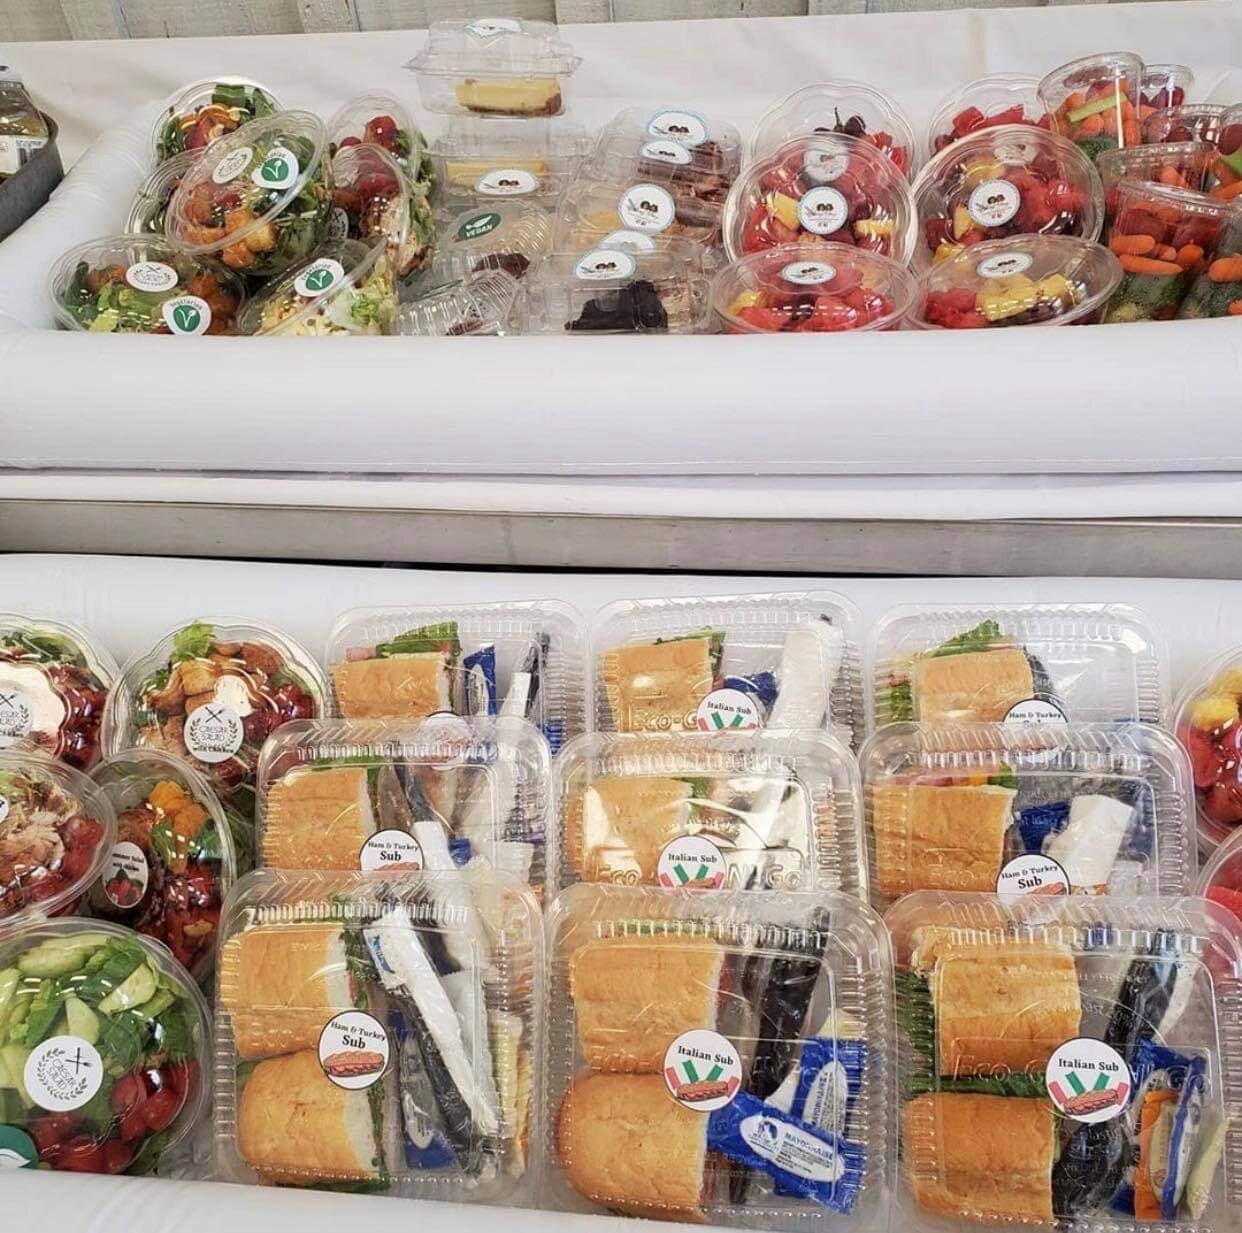
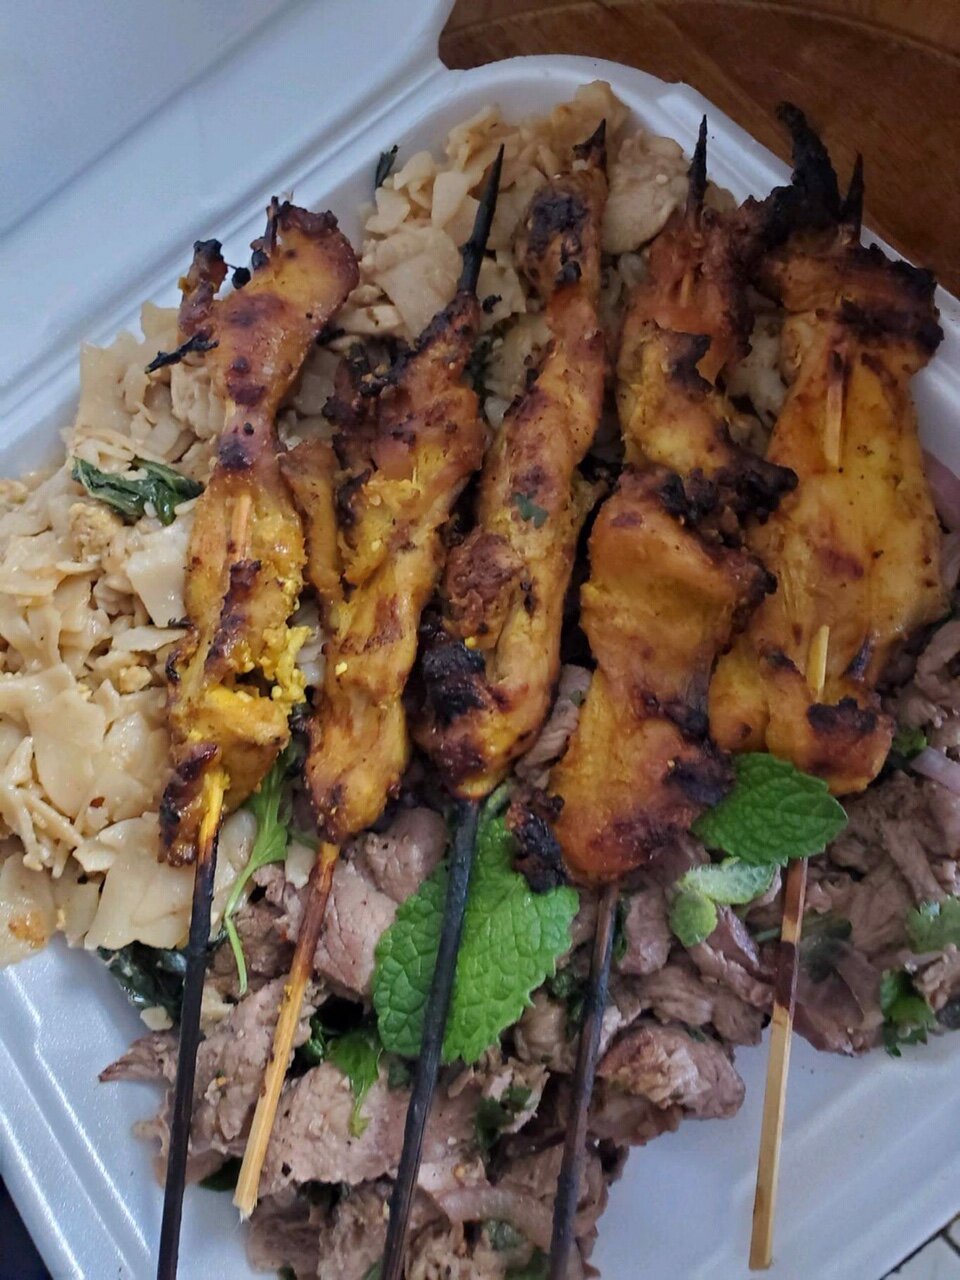
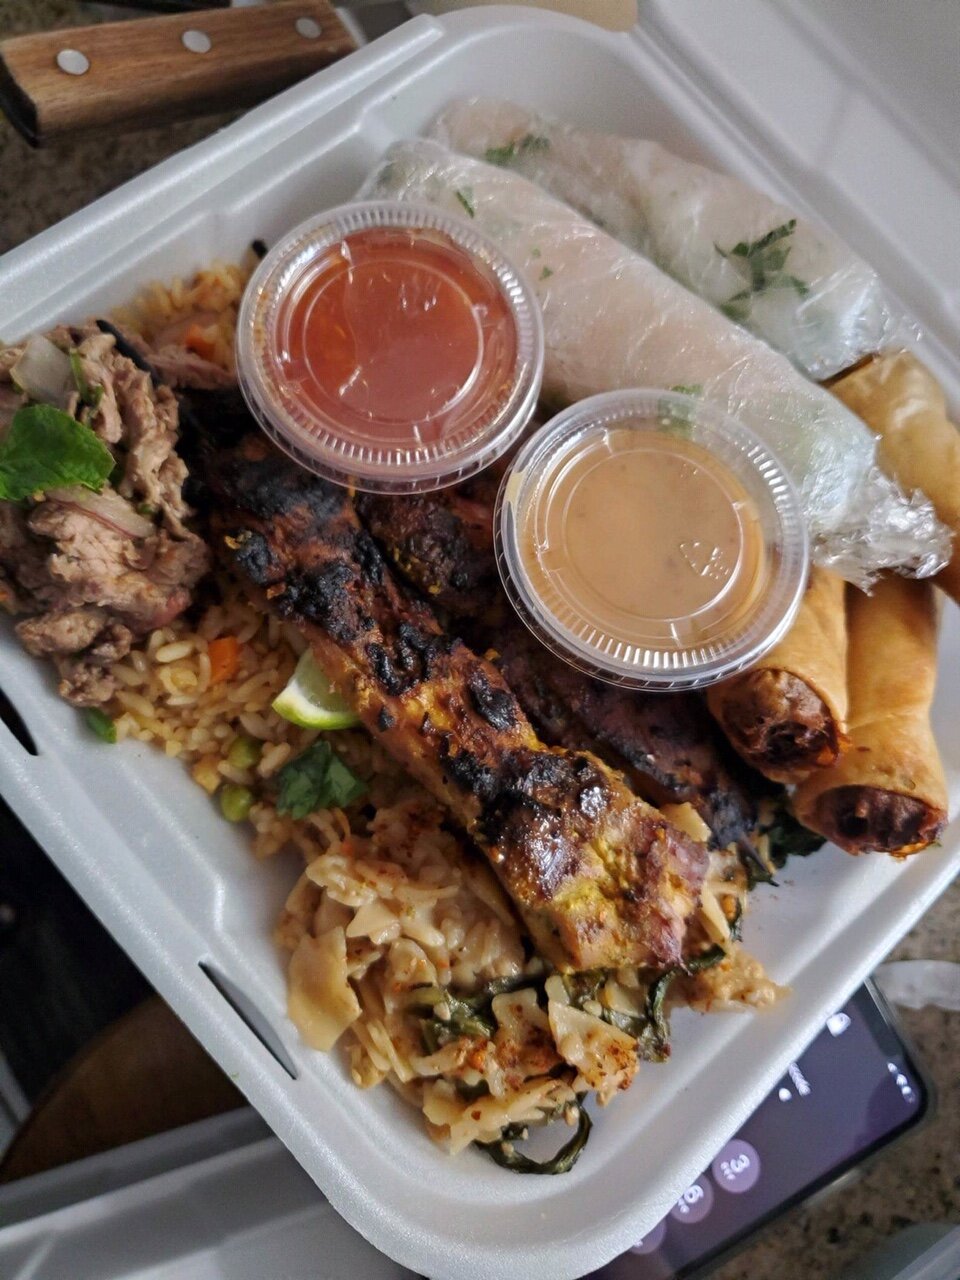
After high school, I started working full-time for Disneyland where I got a lot of experience as a candy maker. I left Disneyland to put my passion to the test and focus on starting my own business with my sister. I am happy to say that it was one of the best decisions I could have ever made, as my sister and I have been running Sweets & Things successfully for five years. We also recently started our own catering business called Yummy Things. Our company has been blessed to be able to cater some fantastic events. The most recent catering job we did was for The Los Angeles Film School.
QUESTION: What do you love most about a career in Culinary?
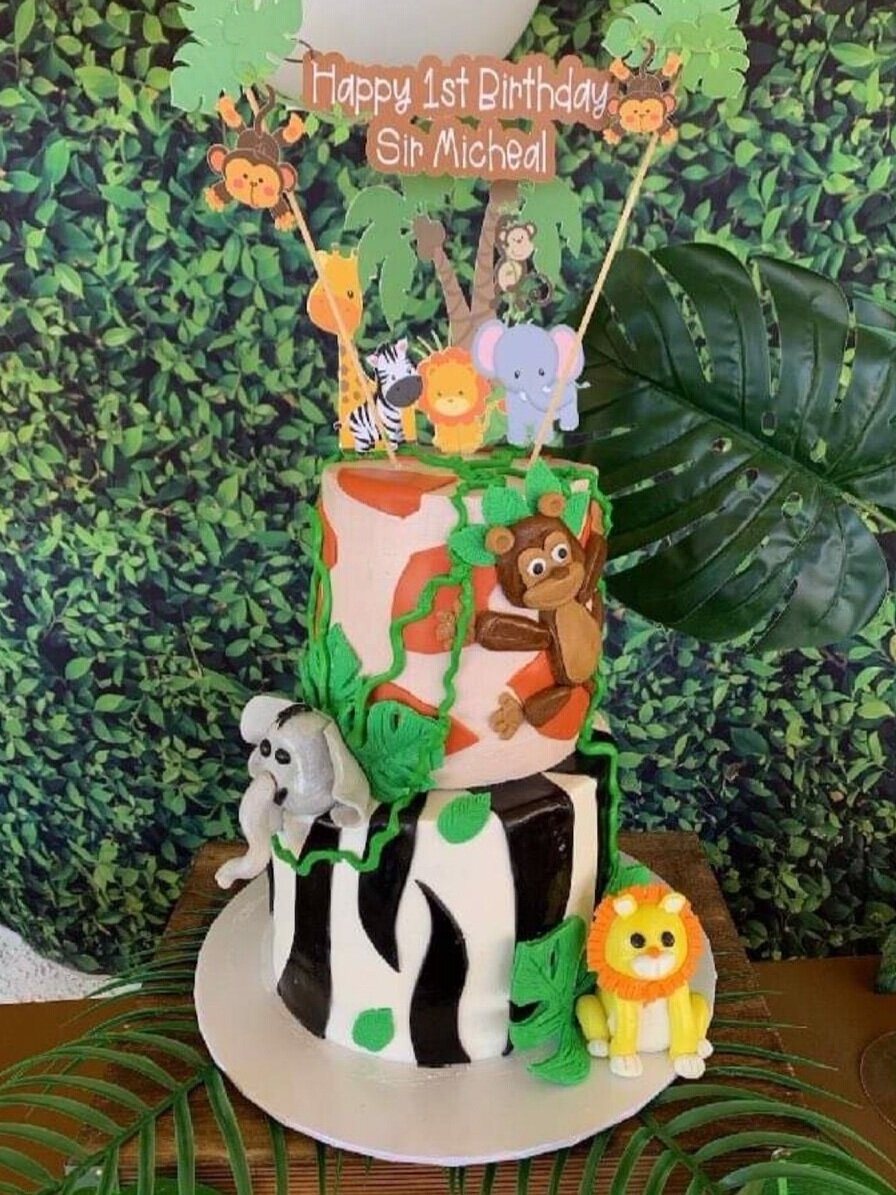
Monique: There are so many aspects of my job that I love, but the ability to create and be artistic is what I would say I love the most. I have always been a people person, so having the ability to work with my customers, take their visions, and bring it to life is so rewarding. I cannot tell you how happy it makes me when one of my customers see their cake for the first time and their eyes light up. Or when I cater an event, and I get to see how happy people are with our food. In this industry, you know you have done an excellent job when your customers return because they are pleased with what you have done for them. Bringing joy to people through my creations is the ultimate gift.
QUESTION: How do you like owning your own business?
Monique: Honestly, I have worked in other people's kitchens, and to have the opportunity to run your kitchen, how you want to, is incredible. Having the freedom to be creative and make decisions is one of the best things about owning your own business. Owning your own business is not always easy; it takes a lot of work and effort and comes with some sleepless nights. We have to work hard to grow our customer base, build relationships with people in our community, and think outside the box creatively with our products and our business. There is never a dull moment when it comes to being a business owner. You also must be able to roll with things. We have all heard the saying, "the customer is always right," and it has never been more accurate than in this business. We rely heavily on happy customers and good reviews. We cannot take things personally as business owners because our job is to bring our customers visions to life. Another aspect of owning your own business is being able to continually reinvent your business. We have recently had to test ourselves while learning how to navigate through the COVID pandemic. We have had to be extremely creative and seek out new and different business opportunities in an effort to keep our business alive.


QUESTION: Do you have any on the job stories that you would like to share?
Monique: I will never forget when I made my first wedding cake for a customer. I have always loved everything about making cakes from start to finish, but for some reason, the stress and pressure of it being my first wedding cake overwhelmed me. I remember wanting to cry, nothing was going right that day, and all I could think of was a crying bride on her most special day. I had made many cakes and never felt this much pressure before. I wanted to make sure it was absolutely perfect for her. I remember sitting there with my hands on my face, feeling sorry for myself. After a long period of frustration, I pulled myself together and told myself this cake is not going to make itself. I spent three times longer on that cake than ever before. After all was said and done, the look on the bride's face was priceless. One of my favorite things now is to be a part of someone’s special day and help make all their cake dreams come to life.

QUESTION: What classes would you recommend for students interested in starting a bakery or catering business?
Monique: I would tell students to take as many Culinary Arts classes as they can. It would also be beneficial to look into some business and accounting classes if they could. When I was in high school, I learned so much from my four years in ASB Leadership. I learned how to put on large events, decorating tips, organizing and planning student activities, cash handling skills, time management, and overall leadership skills, which are all things that help me today in my own business. I think it would be beneficial for students to get involved in their school by joining a club or some type of student leadership because it allows you to learn so many different skills that transition into the real world.

Question: Do you have any advice for high school students wondering what they should do after graduation?
Monique: I was one of those kids that could not go to college right after high school but I knew what made me happy, so I found a way to make a living doing it. I am a firm believer in the fact that everyone has a superpower. I would tell students to go out and find their superpower! Take as many different classes as you can, volunteer with various organizations, go out and network until you find what you are genuinely passionate about. Once you find your passion, find a way to make a living at it. If you do what you are most passionate about, it really never feels like work.


THANK YOU, MONIQUE! YOUR PASSION FOR YOUR CRAFT IS GENUINELY YOUR SUPERPOWER, WHICH IS SO INSPIRING. WE ARE SO PROUD OF ALL YOUR ACCOMPLISHMENTS AND WHAT YOU BRING TO OUR COMMUNITY.
by Jessica Swift

Mechatronics: 5 Things You Should Know
Mechatronics: 5 Things You Should Know

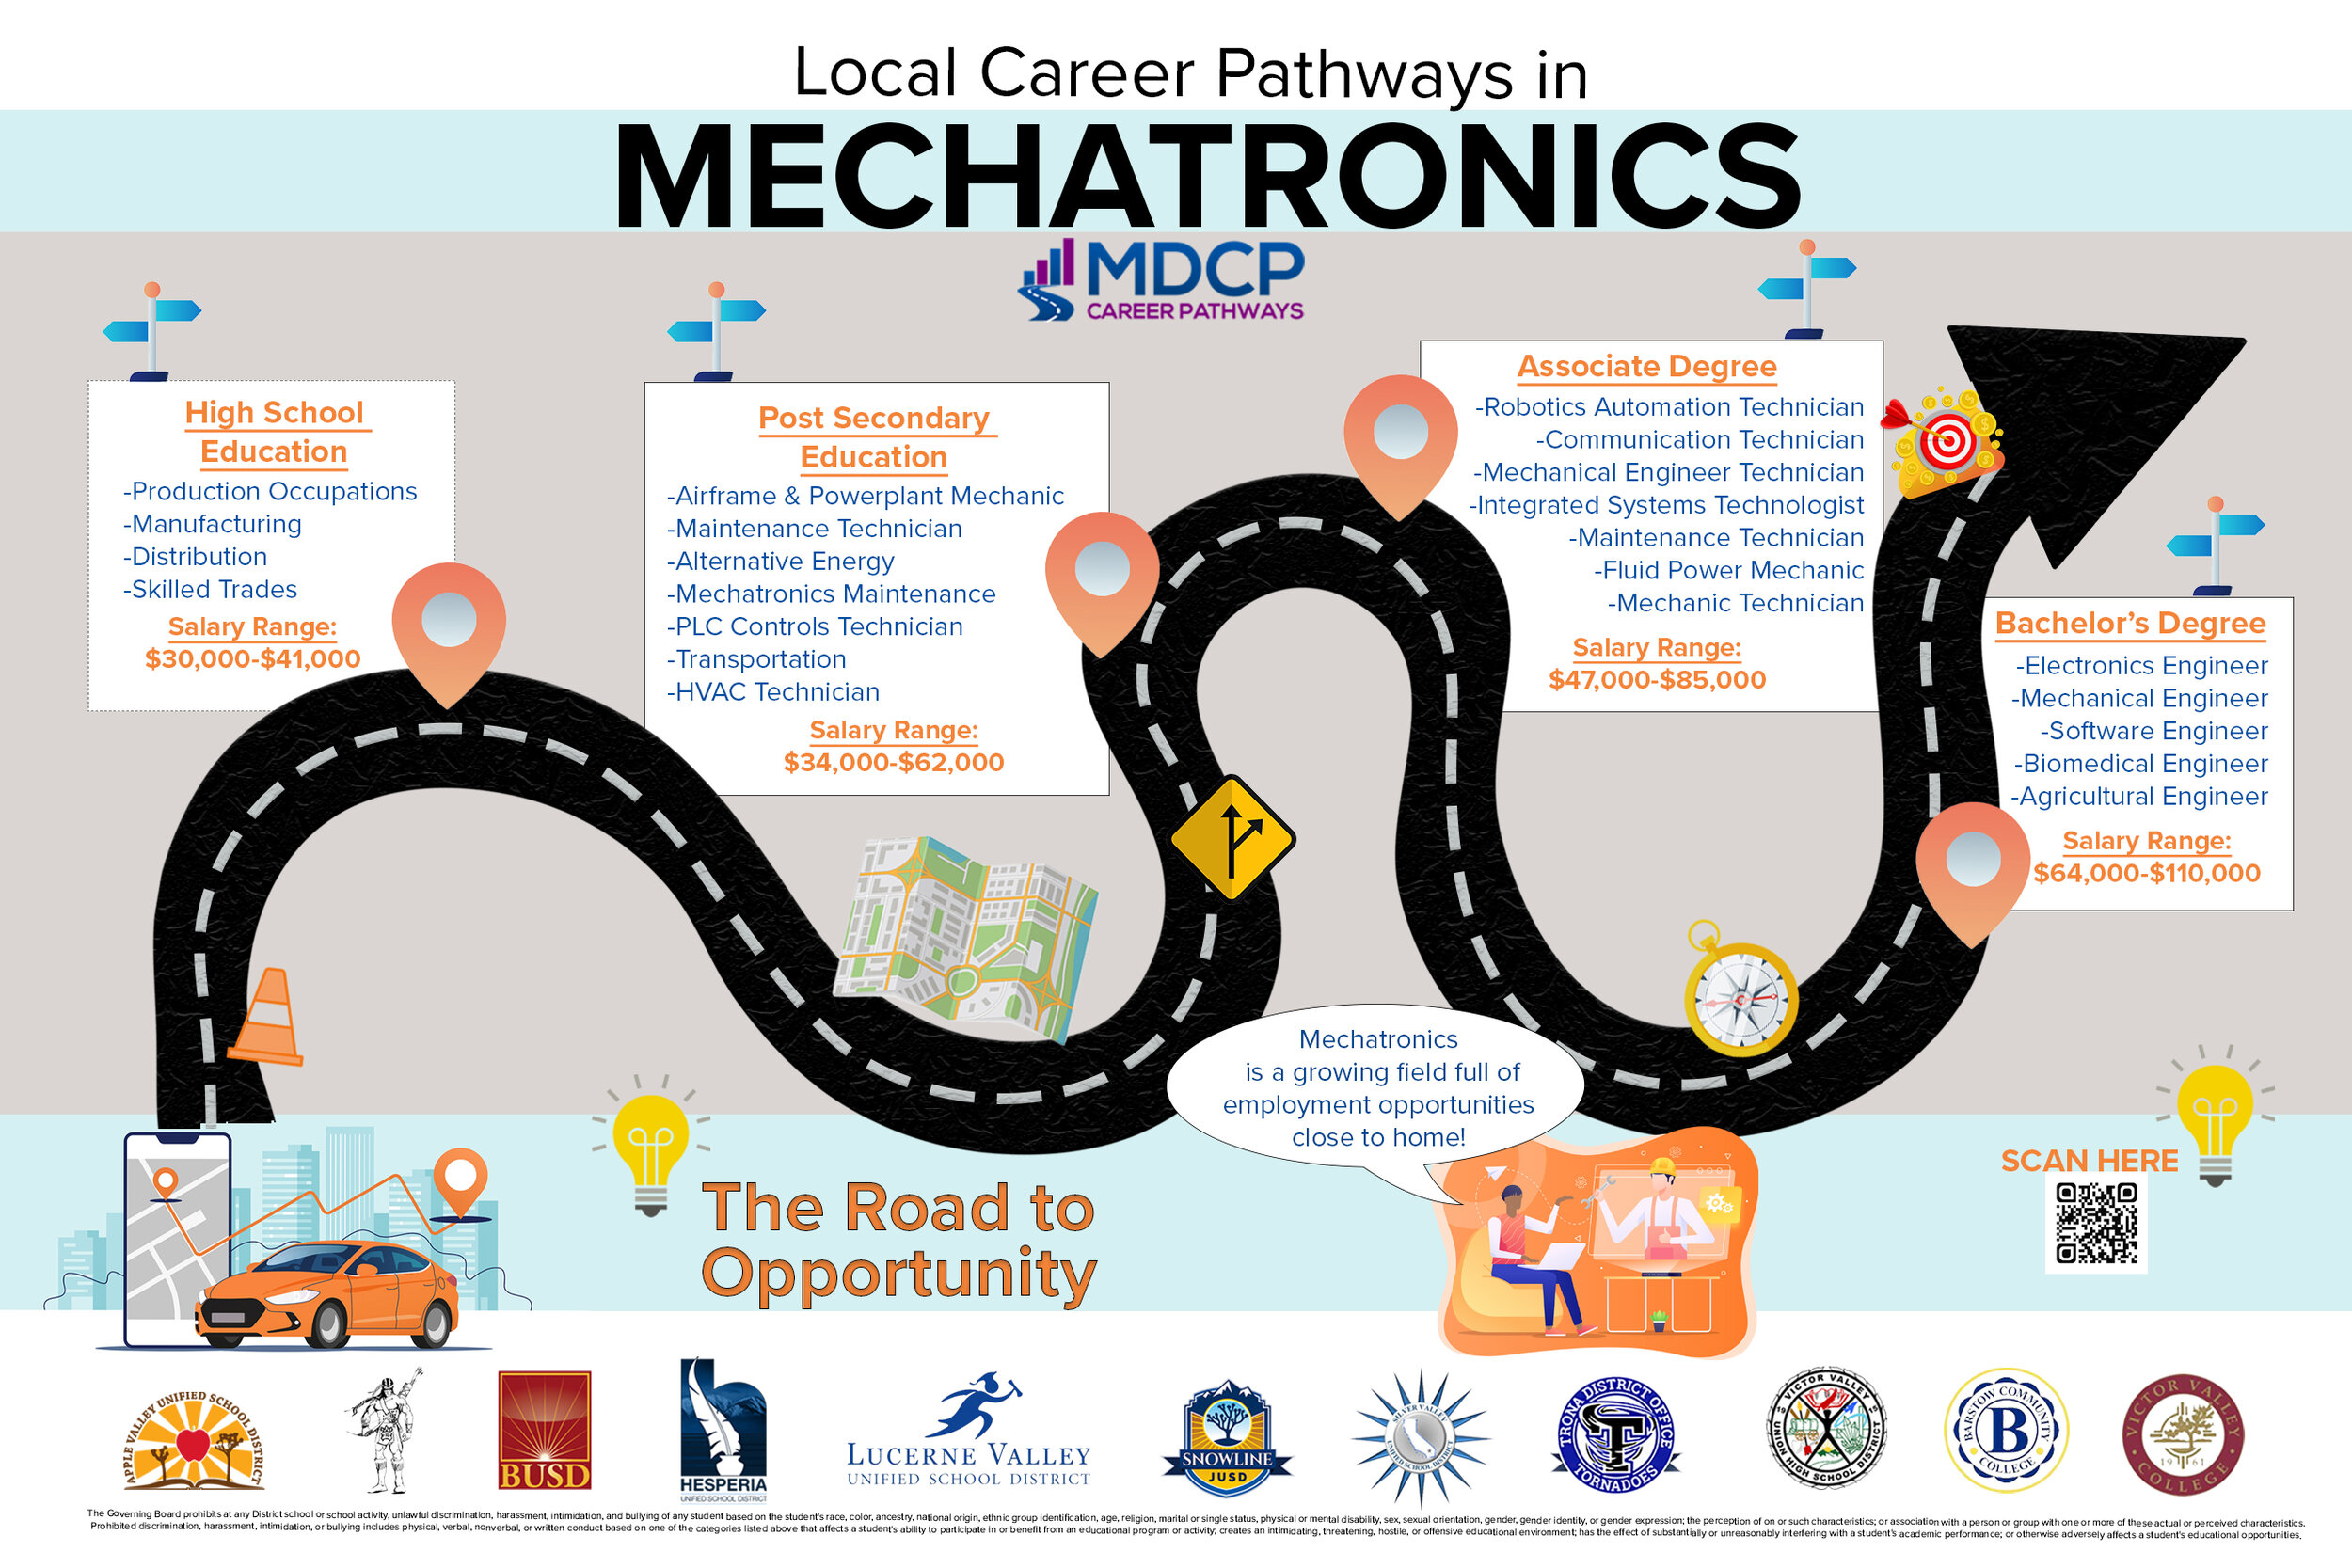
What is Mechatronics?
Mechatronics is a very hands-on emerging field that blends electrical, mechanical, control systems, and software/ computer programming. Mechatronics career fields include electrical, mechanical, hydraulics, pneumatic, motors, sensors, electronics, welding, telecommunications, and computers.
5 Things to Know About Mechatronics:

1. Very Hands-On Career Field: The field of mechatronics is a very hands-on career that allows you to think and work outside the box. If you are a person that likes to take things apart and figure out how they work, then a career in Mechatronics is for you!
2. A Multidisciplinary Career Field: A career in Mechatronics gives you a unique opportunity to combine a broad range of skills in electrical engineering, mechanical engineering, control systems, and computer science. While working in a Mechatronics field you will find that no two days on the job will look the same, which will keep your workdays exciting.
3. Rapidly Growing Career Field: The US Department of Labor has identified Mechatronics as a rapidly growing career field that will grow tremendously in the next ten years. Research has shown that people with multidisciplinary expertise, such as Mechatronics, are more likely to secure employment and advance within their careers.
4. Great Paying Jobs: Today's companies highly value employees with Mechatronics skills and expertise. The salaries of Mechatronics employees reflect that fact. Entry-level Mechatronics employees can earn an average of $50,000 per year to well over $100,000.

5. Meaningful Work: A career in Mechatronics means that you could be a part of creating an invention that improves the quality of life for the entire world. Also, there are tons of opportunities in critical industry sectors such as aviation, manufacturing, mining, and logistics, to name a few.
Fun Fact, the Roomba is a Mechatronic invention. The inventor of the Roomba built the first prototype out of Legos.
Endless Opportunities:
Mechatronics is more than just a job; it is a career with endless opportunities to change the world. Mechatronics jobs are everywhere you look these days from robotics, forensics, pharmaceutical, military defense, aerospace, manufacturing, consumer products, shipping and receiving, packaging, welding, and automotive. If you are looking for a rewarding and innovative career, then a career in Mechatronics is for you!
by Jessica Swift

Paint Them a Picture: Engage Your Partners with Data Visualization
A few years ago, I was tasked with creating reports for our program advisory group. These reports were used to inform the group about our programs on such things as enrollments, student grades, course completions, attendance rates, certification rates, etc. I was new to this position and was given examples of the huge spreadsheet reports that were presented in the past and was directed to follow these examples because this is what the group was expecting. You know, this is how it’s always been done.

Paint them a Picture:
Engage your partners with data visualization
By Andy Page
A few years ago, I was tasked with creating reports for our program advisory group. These reports were used to inform the group about our programs on such things as enrollments, student grades, course completions, attendance rates, certification rates, etc. I was new to this position and was given examples of the huge spreadsheet reports that were presented in the past and was directed to follow these examples because this is what the group was expecting. You know, this is how it’s always been done.
So, I started collecting all the data and started inputting it into these big spreadsheet reports, column by column and row by row by row (there were lots of rows). I added some highlights and formatting to try to make the reports cosmetically appealing, verified the data one last time, and off to print they went.
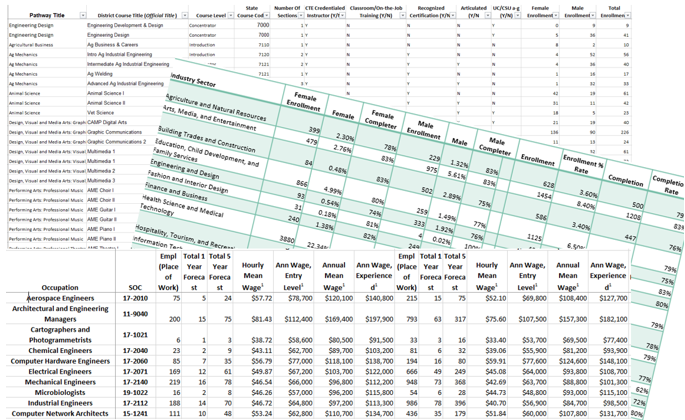
Now here it was, meeting day. I passed out the reports and began trying to explain the information to the group. Look at the first column and follow along this row move to the last column three rows down and turn the page over to see the rest of the data and on and on and on. As I watched eyes glaze over and a few eye rolls, I thought I’m not explaining this correctly, this is important stuff, why aren’t they interested? After the meeting ended, as I was leaving the room, I noticed most of the reports were left behind on the tables or in the trash. I couldn’t help thinking Where did I go wrong? This is what they’ve always received. This is how it was always done.
Our next meeting was coming up in just a few weeks and I couldn’t shake the response the reports I presented at the last meeting received. I started thinking about what I was presenting and how I was making the group work to get the answers they needed. Why wasn’t I just giving them the answer? Aha, light bulb! That’s it, I need to give them the answers. I was a bit nervous because that meant changing the reports they were used to receiving. How would this go over? I mean this in not how it’s always been done. After a bit of reflection, I decided to take the chance. I needed to change the reports and the way information was being presented to this group. I needed to paint the picture for them!
So, I took that data on those spreadsheets and started creating charts and graphs and anything else I could think of that wasn’t a bunch of numbers that went across a sheet in a bunch of columns and rows. This was great, except now I had a bunch of charts and graphs on different sheets that weren’t really putting the whole picture together. I decided not everything had to be reported in a chart or graph, I could just put a number on a page with a brief description. I played around a bit and finally came up with something that fit on two pages (printed back to back) that would give the group the answers they were looking for without having to work for it. I went from these monotonous overbearing spreadsheets to an easy to read picture.

Here we are again, it’s meeting day. I was a bit nervous. I knew I would be changing the presentation format, something the group wasn’t used to. The moment of truth. I handed out the reports and started to explain the information on the sheets. Before I could get through the first visual, one of the group members shouted out “Hey, look at our completion rate!” and another followed with “We had the highest enrollment!” (no competition there). The comments when on and on and not once did I have to explain what they were looking at. The interest and enthusiasm in the room was exciting to see and experience. After the meeting as I was leaving the room, I glanced back and noticed no reports were left on the tables. I quickly glanced to the trash and noticed it was empty. I smiled, closed the door, and walked away with the knowledge that this experiment was a success.
We all have those moments when we must report or present information on a project, a grant, or a program to stakeholders such as parents, advisors or school superintendents and boards. Most of the time you’re limited to the amount of time you have to present. What I’ve learned over the years is they’re interested in what you have to say, but they don’t have much time. And nobody wants to work to find or understand the answers. To be successful in your presentations, to get the response you need or the ask you’re requesting, give them the answers they’re looking for. Paint them a picture. And challenge the way it’s always been done by trying something new. It can be nerve racking, but you may surprise yourself with what’s possible when you put yourself out there. I continue to try new ways of making data accessible and hope you’ll help me think of new ways to do so.
To see more examples of Data Infographic Reports, click the following link: LMI Infographics

Teacher Externships - Bringing Industry Skills Into The Classroom
Teacher externships are a means to providing teachers with an intimate understanding of what the industry looks like today (current practices, work conditions, standard equipment/hardware/software being used, etc.) and what skills their students will need in order to be competitive in that environment.

by Kendle Crowell
Teacher Externships - Bringing Industry Skills Into The Classroom
In our current economic state, pressure is mounting to better equip our students with the skills they need to join the workforce and fill critical needs of local employers. The value of training up our youth to fill local job openings is clear, but how do we ensure students are prepared for what it’s truly like to work out in the field? Relationships between teachers and industry partners are key to these efforts. Although CTE teachers have their own industry experience and are content experts within the sector they teach, industry trends are constantly evolving, so the best place to be brought up to date on those trends is back out in the field. This is where a Teacher Externship comes in.
How Does an Externship Work?
Externships are a means to providing teachers with an intimate understanding of what the industry looks like today (current practices, work conditions, standard equipment/hardware/software being used, etc.) and what skills their students will need in order to be competitive in that environment. Teachers get the opportunity to work side-by-side industry professionals in actual work settings, giving teachers a glimpse into a day in the life of that profession. This immersive experience equips teachers with the knowledge they need to enhance their curriculum with the most up-to-date industry standards.
Understanding career options
Another great benefit of an externship is learning about different careers within an industry sector. Students in a medical program may only be considering becoming a doctor or nurse, but when their teachers can share with them the vast array of jobs at our local hospitals, for example, that could make a tremendous difference in a student’s career trajectory. Employers know best when it comes to their current and future job needs. Tapping into that knowledge through an externship better prepares students for the variety of career options that exist in their back yards.
Our teachers are committed
We all know that a teacher’s work never ends. There is no clocking out when it comes to supporting students and preparing them for success after high school. Summer break is normally the best chance for them to unwind and unplug, but our teachers are committed to learning and growing for their students, even during their summer vacations! During the prior two summer, teachers from across the region participated in multi-week externships brushing up on their Aviation and Engineering skills at General Atomics Aeronautical Systems and ComAv. This year, three teachers from Hesperia Unified participated in summer externships, but more than a dozen requested placement at a local industry site. You read that right - they requested to take time out of their summers to brush up on their skills. Unfortunately, COVID restrictions prevented all of them from finding industry hosts, but the eagerness of these teachers truly speaks to the impact these experiences can have!

During summer 2018, four CTE teachers from three school districts (Apple Valley, Hesperia, & Victor Valley) completed a multi-week externship with General Atomics.
Summer externships - 2020
In July, three externships took place with industry partners at The Southwest Carpenters Union, Kranbox Video & Photography and Grand Mobil. Through these experiences, teachers identified skills needed in the occupations observed and developed strategies to bring those skills back into their classroom instruction. Here’s what one teacher had to say about her experience:
“I learned so much. It was such a great experience! I’m feeling so inspired and can’t wait to share with my students.”
Industry partners also benefit from these experiences. They now have an “in” with students. The teachers become advocates for these companies within the classroom, impacting the next generation of industry talent. In addition to gaining some free man/woman power on the job site, they get to learn more about all the amazing things taking place in CTE classrooms, gain an understanding about local teacher and student talent, and provide input into the skills students master in the classroom. Through these experiences, strong relationships are built between education and industry. We hope all involved gain a deeper appreciation of the opportunities that await them through opportunities such as externships, job shadowing, fieldtrips, guest speaking, etc. These relationships are at the core of a CTE program’s success and prime the pump for companies to acquire highly skilled talent.
Industry’s role
So many industry partners can relate to the journey of a high school student; they were once there themselves, after all. The value of someone from the “real world” sharing their experiences and offering a hand up to the next phase of life is not lost on them.
“When I was working my way into my career, I was very appreciative when someone would let me shadow them, answer questions or give advice. I understand how helpful that can be so I want to be able to help others when I can.”
We know there are many other industry partners in our region, like Tessa, who would gladly help our CTE teachers and students, they just need to understand how it all works, what their role is, and how to get started. If this sounds like you, please contact MDCP. We’ve provided a link below to get started. We can help your business come up with a game plan to seize economic opportunities and attract locally trained talent through a variety of touch points, including teacher externships. Pretty soon, your business will be a household name and graduates will be seeking you out.

Women Can Be Millwrights, Too! Meet U.S. Borax’s FIRST FEMALE FIRST CLASS MILLWRIGHT
A millwright is a a coveted position filled with challenges and opportunities. We’ve connected with a very talented female First Class Millwright in our own backyard.

THE FIRST AT U.S. BORAX
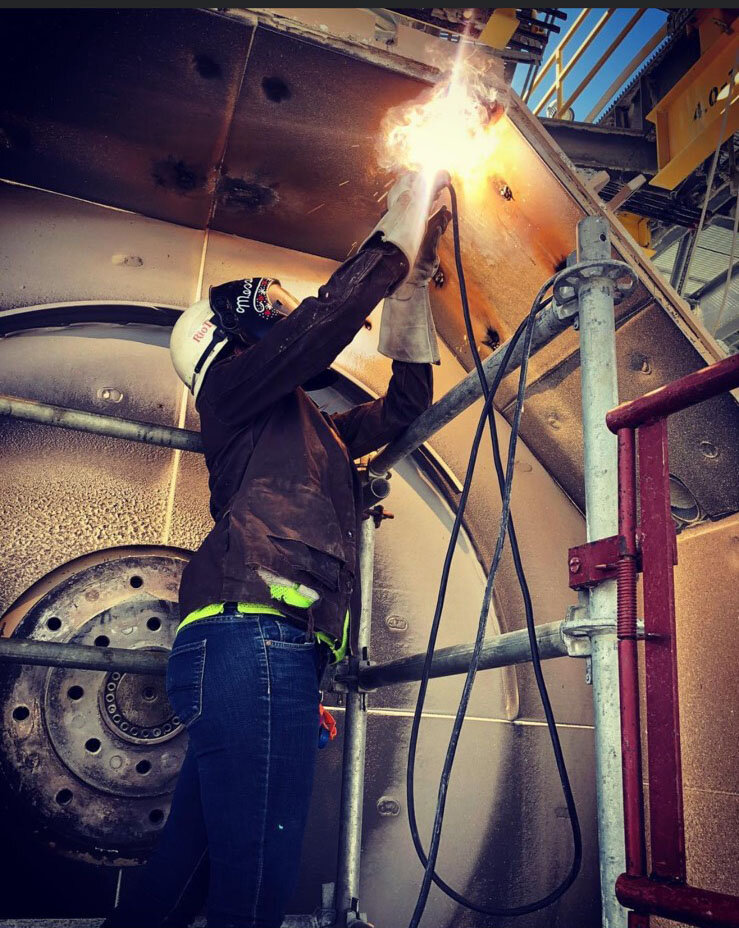
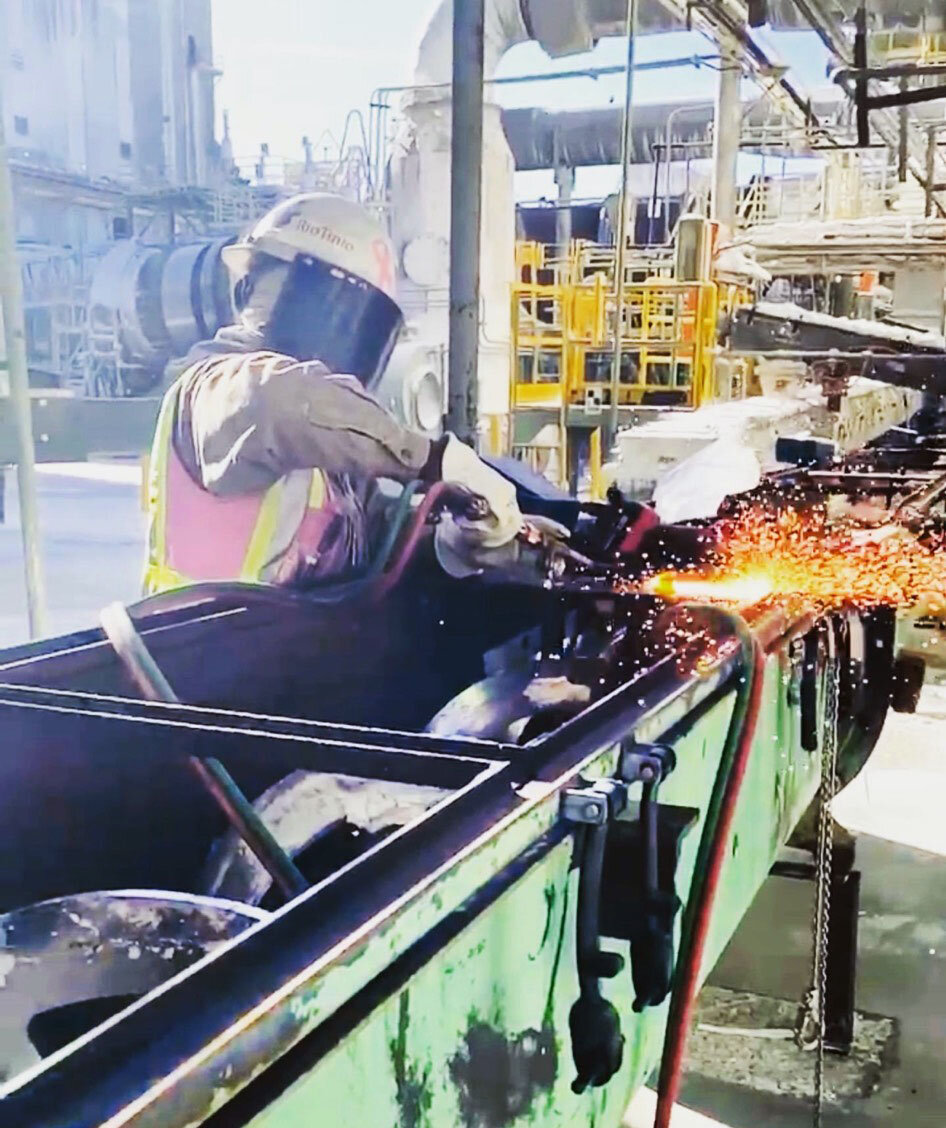
Working on rock crushers and conveyor belts at a mine might not be the job that every girl dreams of . . .. but to Jessica Messick it has been a dream come true. With a ton of hard work, a positive outlook, and years of training and certifications, she’s managed to make her dream come true and become the very first female First Class Millwright at U.S. Borax with Rio Tinto.
U.S. Borax (Rio Tinto) is located about 40 miles west of Barstow in Boron, California. U.S. Borax operates California’s largest open pit mine -- one of the richest borate deposits on the planet. While boron is present everywhere in the environment, substantial deposits of borates are relatively rare. Borates are used to produce numerous products from cleaners and detergents to batteries and capacitors to metals and gold. U.S. Borax supplies nearly half the world’s demand for refined borates, minerals essential to life and modern living. https://www.borax.com/borax-operations/boron-california

Jessica Messick, First Class Millwright
Jessica’s a Barstow native that attended both Barstow High School and Excelsior and graduated in 2008.
jessica’s STORY
A few years after high school graduation, Jessica started working for Rio Tinto at U.S. Borax, where she quickly decided she wanted to become the first female First Class Millwright. The journey wasn’t a walk in the park but her hard work and passion to work up the ladder and make history was too enticing to give up. Her story is completely compelling and one that will inspire you.
QUESTION: Jessica, would you describe what you do and how you got to your current position?
Jessica: In my position I maintain and repair most of the equipment and machines at the mine. There are so many processes that are done at the mine, and that means lots of machines and equipment to repair and maintain.
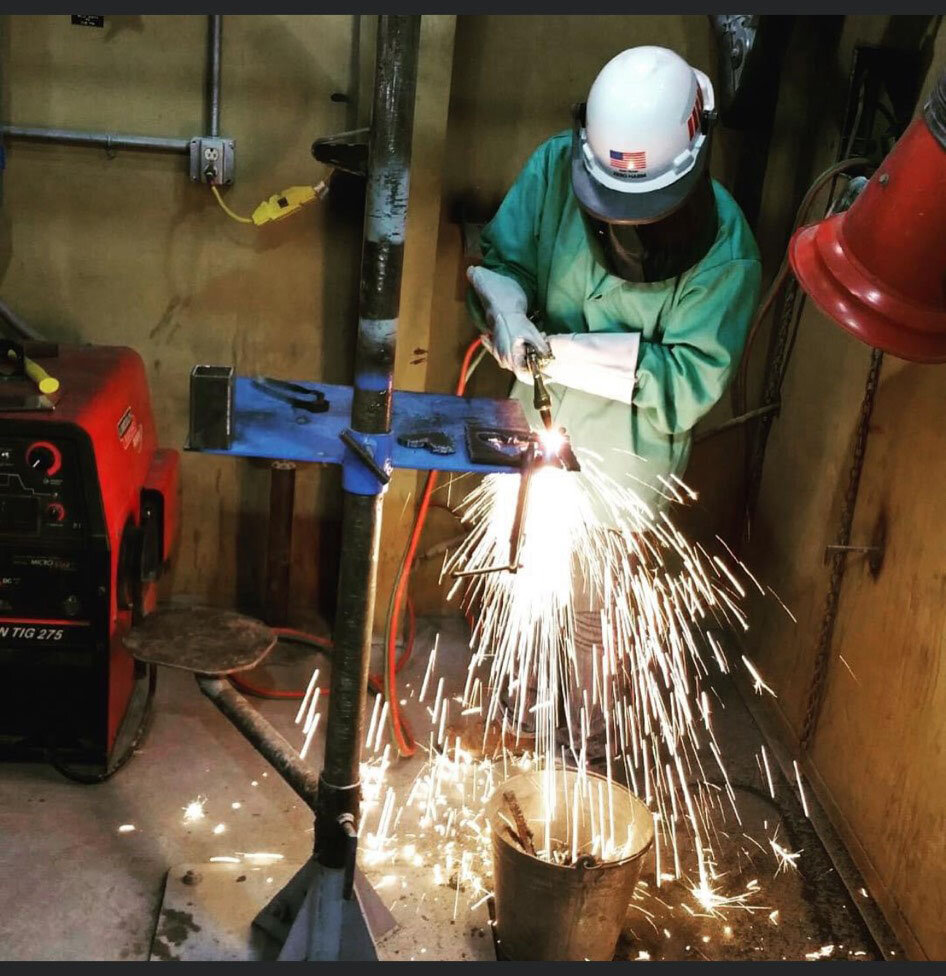
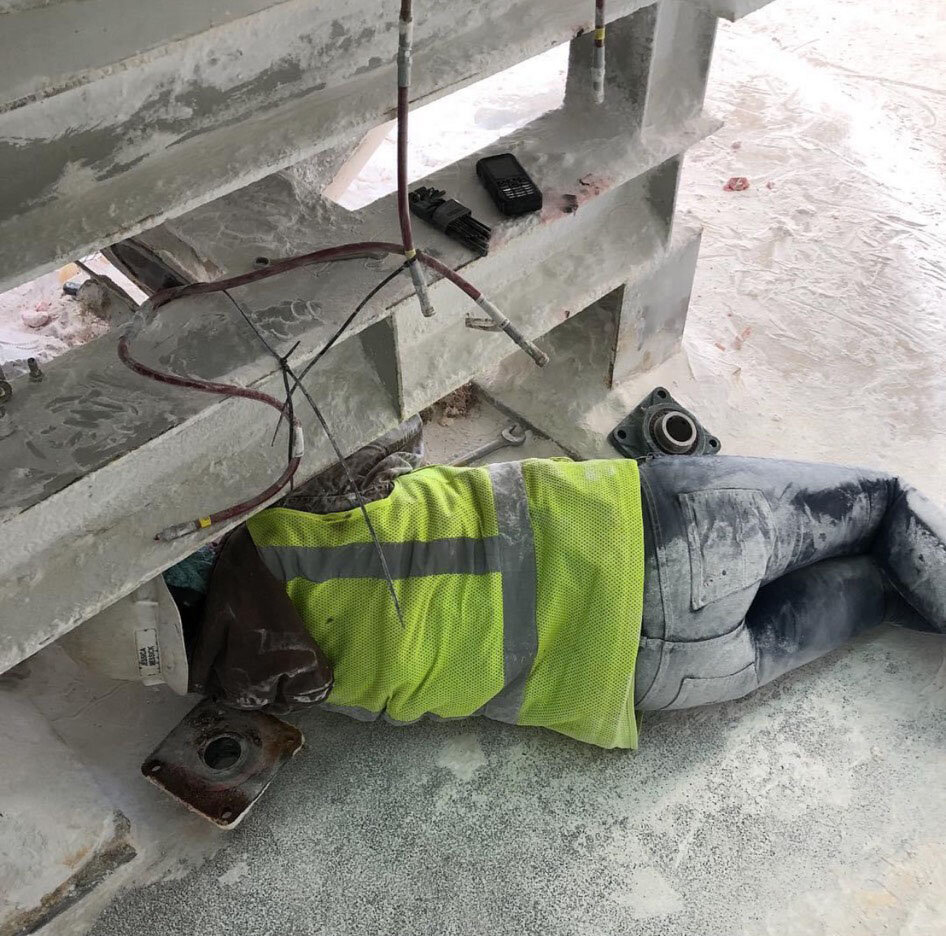
Some of the tasks that I do at work are welding, small fabrications, and installing pumps and gearboxes for heavy machinery. I diagnose and repair all types of rotating and conveying equipment, including bucket elevators, screw conveyors, belting, and materials handling. I work on centrifuge machines, rock crushers, and other large machinery. Another part of my job is to know how to move large equipment and things at the mines. This requires that I know how to give and receive crane signals and be able to calculate loads and rigging correctly. I work at heights which require climbing in a harness. I use JLG’s, man baskets, and scissor lifts, along with working off scaffolding. There are so many different types of equipment and machinery out there that always need repairs or some part replaced so my job never gets complacent or boring. There’s always something new to work on or learn.
I started out as a janitor and then applied for a Millwright Helper the second it came out. I was hesitant at first because there had never been a female to make it to First Class. And out there it is a pretty male dominant place. My dad is a First Class Millwright in the industry and with his help and guidance I applied and passed a math and aptitude test. I studied super hard and aced both of them ... not thinking I would. I went through a four year apprenticeship program called NCCER. Rio Tinto (U.S. Borax) paid for me and the other guys to go to school at work. Each week we spent two days in class and two days in the field training with a First Class millwright. We worked four 10 hour shifts each week. I will have to say that going through the program being the only female was challenging at times but I was doing what I loved and gained a bunch of respect for showing that I was dedicated and determined to keep up or even pass up some of the guys. Having my dad as a role model and a mentor really helped.
QUESTION: How many years have you worked for Rio Tinto?
A total of 8 years. I was a janitor my first two and half years, a Helper Millwright for two years, spent two years as a Second Class Millwright, and I’ve been a First Class Millwright for a little over a year.
QUESTION: What would you say is the best thing about working for your company?
Rio Tinto gives you lots of different varieties of jobs and careers. They are very focused on safety and quality. Pay is good and it's close to home. They offer lots of learning opportunities and they offer NCCER training and certifications for millwrights and electricians.
QUESTION: What types of certifications are required for your position?
You start as a Helper Millwright then move up to Second Class Millwright, and then on to First Class Millwright. A Helper does not really require much, just a standard math and aptitude test, but a background in maintenance or welding is always good to have. A Second Class Millwright has to pass both tests (math and aptitude) and pass a 3/8 plate test (weld two plates together and have them bent). A First Class Millwright has to pass both tests (math and aptitude) and then a 6g 6'' pipe test (weld two 6" pipes together and cut and bend them). For a Second and First Class you must have a background in welding and some pipe fitting, along with knowledge of industrial work and working around the different types of machinery and equipment a mine site has.

QUESTION: You mentioned that you were trained at Rio Tinto, what certifications/training did you earn on the job? Did the company pay for these?
The company paid for everything. I had a schedule of Monday thru Thursday from 6:00am to 4:30pm with two days in class and two days following and helping a First Class Millwright. Going through the four year program gave me a ton of certifications, like operating a forklift and a scissor lift, a JLG lift, and a bobcat. I also got trained on rigging loads for a crane and learning the different hand signals. I can inspect scaffolding and fall protection. I also have all my certificates for completing all the different books the NCCER requires you to have like aligning pumps and motors, welding, and blueprint reading. There are so many it's hard to name them all.
QUESTION: Did you take any high school/college courses to prepare you for your career?
I did not take any extra classes in school but I wish I had taken classes like welding and blueprint reading. Anything to do with maintenance would've helped a lot. If I had I could have started my career a lot sooner and made a lot more money faster.
QUESTION: Did you have any hobbies or interests outside of school that prepared you for your career?
My hobbies are spending time with my family (a fiancé and two kids). Ever since I was super little my family has always been into off-road racing. Being around and a part of that prepared me - I learned about hand tools, power tools, working on motors/engines, and some welding. These are all things that helped prepare me for what I do at work. I’m not one that’s afraid to ask questions on how something may work. I have always been open minded and willing to lend a hand. I’ve never been afraid to get greasy or get my hands dirty from working on or around the race cars. Also, I have always found it very intriguing how the mining industry works. I think it’s awesome how they can take a simple rock and turn it into a product that is in almost everything we use.

QUESTION: Taking all that you experienced with your career, what advice would you give high school students in order to prepare themselves for a career or just life after high school?
Stay focused on your goals. It helped that I had a role model to look up to and guide me in the right path (my dad). If there is something that you don't think you could do or achieve YOU CAN, it just takes dedication, hard work, and you have to be passionate about it. If I can do it anyone can!
QUESTION: What steps would someone take to find out about positions at U.S. Borax (Rio Tinto)? Any helpful advice on the process?
For someone looking to get hired on at Rio Tinto, the best place to go is indeed.com. Rio Tinto is always posting and pulling jobs off of that site so you almost have to check it daily. You can always start out at the bottom and work your way up like I did. It doesn’t take very long to move up out there. A Millwright really only requires you to pass a welding test and a simple math and aptitude test. There have been First Class Millwrights hired on that are very young. Experience is good to have. Millwrights are hard to find nowadays; even machinists are hard to find. Rio Tinto has a wide variety of jobs: welders, haul truck drivers, electricians, shipping department utility workers, laborers, plant operators, and a few others. You got to love what you do!
QUESTION: What are the coolest things about your job?
It’s fast paced and there’s always something new to learn and experience. I love what I do. I love a good challenge, and sometimes the jobs can be very challenging. I like the fact that I get to work with my dad. I love the atmosphere. I like making history and becoming the first female First Class Millwright! :)
QUESTION: If you could switch jobs with anyone else at your company, whose job would you want and why?
I love where I am now. I would not want to change my job. This is the job I wanted and strived for. I work my butt off and have proved that a woman can do the same thing a man can do.
Thank you, Jessica! Your enthusiasm and excitement for what you do is truly inspiring. We’re so proud of your accomplishments and are looking forward to learning about you mentoring and training up the next female First Class Millwright.
by Carrie O’Neal

Labor Market Information: Investing in programs with promise
Understanding Labor Market Information (LMI) is a critical piece of the puzzle to ensuring we’re investing in the right programs.

Labor Market Information: Investing in programs with promise
Training students up in career paths that have promise is extremely important to us at MDCP. We want our students to gain top notch skills in areas that will equip them for well-paying, family-sustaining, local, in-demand careers. We do our students a disservice if we train them up with state of the art basket weaving skills, when nobody is planning on hiring basket weavers. We also fail our local industry if we train up students with skill sets they’re not looking for in their employees. Industry partners need our students to be trained in the skills they actually need in order to improve their company’s economic longevity and success.
There are multiple ways that we do this, but here are three important ones:
We hold advisories every year in every sector to acquire real-time industry-specific information directly from our industry partners.
We send teachers on job shadowing experiences, externships, and site visits to see industry in action.
We analyze regional labor market information (LMI).
I’ve found that LMI can be tricky. The first problem: for years, it has been difficult to even get my hands on data specific to the High Desert. Secondly, the data can be super confusing - spreadsheets and queries from different years, sector names that change based upon the report you’re looking at, etc. Thirdly, often when I would discuss LMI reports at advisory meetings, the data wouldn’t match the real-time feedback from industry partners.
Last year, we were able to acquire a license to Chmura’s JobsEQ which enables us to pull reports as desired on local jobs, trends, employers, etc. It’s not perfect, but it’s a significant piece of the puzzle. Now we’re able to pull localized reports when needed and can compare them with what we’re hearing from the field and what we see in other reports.
However, I also learned that many decision influencers, both in education and beyond, desire a better understanding of LMI, where to access it and how to digest it, so the best programs could be offered regionally. Now, there will always be programs that capture students’ hearts and curiosity and may not be tightly aligned to a burgeoning market opportunity. However, it is our burden in education to ensure we are modifying our programs to ensure they are focused on in-demand skills and opportunity, which all our stakeholders need. MDCP and all of our districts take aligning to industry very seriously. While it isn’t something that necessarily happens overnight, it is something we continue to prioritize so our students and our region is poised for long term success.
Parents, too, want this information to best guide their children towards optimal career opportunities. Industry partners, likewise, want to better understand LMI so they can shape their recruitment and long term planning strategies.
Thus, I asked Andy Page, our Data Guru, to whip up a resource that would give some basic LMI 101, Tips, & Suggestions. Her resource is included below. I hope you find it useful. Please feel free to share this with others as is helpful. The more we understand LMI, the better we’ll be able to position our region for long term, significant success. And please - ask us questions and challenge us with your labor market information needs. It will help us and our programs get better.
Matt

The Business Benefits from Engaging with Students
The benefits to businesses who engage with students are plenty. Here are our top 5.
5 Business Benefits from Engaging with Students
While we’re in the game of supporting our students in their journey to great careers, a linchpin in that game is a strong network of industry partners who provide the motivation, inspiration, and goals for those students. We will always celebrate partners who work with our students for the benefits to students. However, we’d be remiss if we didn’t highlight the benefit to the industry partners.
Because engaging with students is so beneficial to everyone involved, we created this brief booklet to highlight 5 of those benefits. Incredible outcomes have been accomplished and are underway with our partners and we look forward to expanding our network and collaboratively continuing to impact our region economically for all.
And don’t worry - there are plenty of ways for industry and students to continue to engage meaningfully during the virtual learning environment of COVID - virtual fieldtrips, subject matter expert webchats, small group mentoring, and more. Contact us and we’ll get crafty.
PDF Download of 5 Business Benefits to Engaging with Students

College Articulation: Shortening the path to college completion
Articulation for the 2019-2020 school year was a huge success. Check out these numbers!

It’s time to celebrate. Thousands of local students just shortened their path to college completion.
By Matt Wells
Because of this incredible opportunity called Articulation, students at our high schools are able to earn college credits at Barstow Community College (BCC) and Victor Valley College for their top notch work in their Career Technical Education courses. From Aviation to Culinary, Medical to Welding and everything in between, students from 9th through 12th and even adult education submit their grades to each of these colleges after crushing it in the classroom. The students apply to the college (Free), submit their A or B course grade through their school (Free) and earn a college transcript with the A or B in the equivalent course at the college (Free). When they’re ready, students can continue their education at one of those colleges and can skip the first course or two in related certificate and degree programs. This means saved money and shortened time to careers.
I’ll be honest: with COVID shaking up the school system, I anticipated we’d see a dip in our articulation numbers this year. While the process sounds easy, there’s a ton of leg work that goes into supporting all of the college applications, the completion of the requisite coursework, submitting the grades to the colleges, etc. I’m so happy I was wrong.
As a numbers nerd, let me geek out and share with you some of the data that gets me all fired up.
1. 3,558 college grades were issued: 167 at BCC; 3,391 at VVC
2. These numbers represent a 98.81% increase at BCC from last year and a 24.03% increase at VVC.
Check out this graph of VVC grades over the last few years! This increase is significant!

3. We have some kids who earned credits in 2 or even 3 different college classes. But, I checked to see how many individual students earned credits: 3,138! That represents just over 13% of all the 9th-12th grade students in our districts. 13% of all high school students are getting college credits while in high school through articulation. And this doesn’t include Dual Enrollment or AP exams, which are other avenues to college credits.
In all, students earned credits in 34 different VVC courses. Although much smaller than Victor Valley College, Barstow College packs a punch with students earning credits in four courses.


I’m so proud of my colleagues at our districts and at the colleges. They’ve worked so hard supporting students through the application process, helping one another through the grades submission efforts, and collaborating together to revise and improve procedures year to year. While the results this year were amazing, there’s nothing to indicate next year won’t be even better. I’m also proud of the industry partners who’ve stepped up and encouraged students to take this opportunity and run with it. And I’m most proud of the students who have worked their tails off in their classes, earned top marks, and seized their well-earned college grades, opening up the options for their future.
Thank you to each and every one of you. Keep crushing it. I can’t wait to see what happens this next year.
Matt

The Skills of Skeels: Living the Dream in Local Aviation
Meet Lisa Skeels, a young woman doing amazing work with the local aviation company, ComAv. There are incredible industry opportunities in our region. Lisa was happy to share about her journey and the fascinating career she’s making in the HD.

I’ve always found networking to be a bit of a challenge. I’m the guy who struggles with small talk – with knowing what bridges in conversation might connect me with someone I find fascinating. When you meet someone who has the gift of networking, who can work a room or slip him or herself into a conversation, it’s, quite frankly, a thing of beauty. And while this is a dance within which I continue to trip over my feet, I am learning and getting better. I owe my improvement to many things but one cornerstone of that is wonderful people with a passion for what they do - the kind of people who can’t help but ooze interesting stories. I’m lucky in that these same people tend to want to pass on that passion which means connecting with students – my line of work!
A brilliant young woman who I’m now lucky to call friend, Lisa Skeels, joined me for lunch recently so I could pepper her with questions at a rapidity akin to my 2 ½ year old son and his newly acquired skill of speech. After an hour of interrogation that barely allowed her to touch her meal (I told you I was still learning), Lisa had given me a peek into a local aviation company and her career within that both inspire and excite me. Read through our conversation and be sure to ask yourself: What kind of company/industry do you currently or want to work for and how are you going to get there?
Lisa, thank you for joining me for lunch. I am so excited about this because I know what you share with me will inspire students in the region.

No problem, anytime! Excited to share this journey and hopefully help another achieve their goals!
So first off, what’s your title?
I’m the Director of Corporate Marketing & Process Control for the ComAv Companies, located at our worldwide headquarters in Victorville, CA.
And in a quick, overly generalized summary – what does ComAv do?
Whether its aviation maintenance, redeployment, storage, disassembly or evaluation, through our Asset Management and Technical Companies, we offer a broad range of premium solutions that are individually tailored for our premier clients in the commercial aviation industry.
I know ComAv has quite a vast operation here locally. Where is your customer base?

Our customer base is global. Along with our international offices we extend our presence in places such as Asia, Europe, Latin America and Canada.
What does your typical day look like at ComAv?
(Laughs) Well, I don't know that there is a typical day. Aviation is ever changing and fast paced, which is something I love about being here. But, here's an example of my day - In the morning, I work with a team of my colleagues on project planning to assess the items of the day. The key to a successful week is project management - with so many integral items of business operating at once, this is critical to ensure projects are on schedule and being completed successfully. From there, we review our sales goals, items of acquisition, protocols and business development initiatives… That could be a discussion on our recent acquisition of a new aircraft, new engine or coordinating a large receiving effort.
(At this point, Lisa takes a sip of her coffee from her ComAv cup, logo appropriately pointing forward to her guest. We both laugh at her ever-living roll of leading marketing.)
We are always coordinating efforts with various airlines around the world, developing relationships and networking. While we work with airplanes, we also care about people and our customers. It’s important to us to keep our relationships as we value our clients and their business. When that is your focus, everything else comes together naturally, helping you be successful.
The afternoons are dedicated to internal initiatives such as process control and any risk mitigation efforts. To be successful in business, it is important to monitor every role in our company for efficiency as well as compliance. As a company with global work, we have both the Federal Aviation Administration (FAA) and all of their worldwide counterparts to comply with. Having multiple authorities whose regulations must be complied with requires frequent quality control evaluation. Also, I may do some risk mitigation work. My career path has developed me into an aviation jack of all trades, which means my days are varied and provide lots of challenge. And I love it.
How did you end up in aviation? Was it a dream since you were a little girl?
My passion in life seemed to sneak up on me. When I was younger, I was unaware of the full business scope behind the aviation industry. I wasn’t sure what I wanted to go into when I started college. I’m a rock nerd. I was studying geology in college and thought that’s what I wanted to do in life. I ended up moving from Michigan to Florida on a whim and while in Florida, my best friend introduced me to an MRO (Maintenance, Repair, and Overhaul) company. I took a position as an assistant to the Chief Financial Officer. While in that position, I assisted him in business initiatives of the FAA Safety Management System (SMS) Program that sparked my interests even more. I had to quickly learn about the industry – all aspects of it, really. It was an entry-level role at the time, but I found myself in different departments, gaining different experience in a way that gave me a broad understanding and sense of what the MRO world is all about. I then also decided to attend Embry Riddle Aeronautical University in Aviation Business Administration to gain the theory at one of the top aviation universities, and it has led me to many wonderful opportunities within the industry and with ComAv. In short – I fell in love.

An aircraft sits right outside ComAv’s wide body hangar used for long term maintenance programs
So what happened next?
Well, initially I didn’t have the military experience, mechanic licensing (Airframe and Powerplant or A&P) or corporate background that many others in the industry do have, so I knew that I needed some leverage. Getting that leverage meant getting more education and I wanted to get into the Business and Financial aspects of the industry. I attended Embry Riddle Aeronautical University, which has a fantastic aviation/aerospace focus. I earned a Bachelor’s degree in Aviation Business Administration. I’m currently still attending Embry Riddle to complete my Master’s degree.
Are those the typical paths in your industry? Military, mechanic, or bachelor’s degree?
I wouldn’t really call anything typical. It’s all about finding the path that makes sense for you to start on and making the most out of it. Every path you can take within this industry can give you that experience and guide you to your goal. I know executives that started by changing tires on airplanes, worked every role on the way up and now run multimillion-dollar companies. They also are among the most respected leaders in the industry. We all start from the bottom somewhere. It’s all about your work ethic and your drive that can move you forward.
We hear a lot in education that industry experiences new hires who want to start at the top, making incredibly money right out the shoot.
You earn your salary with experience and hard work. Aviation is a very reliable and fulfilling way to earn a living. However, you have to look at the career path that you know you would succeed in and work your way up from there. I knew that this industry was going to take me places and that I was going to make a good living one day but not without hard work and really identifying where I would make the most impact.
Let’s be frank about something – you’re a woman in an industry that is dominated by males. What’s that like and what advice would you give a young woman reading this who is considering following your lead?

David Stringfellow, ComAv’s Director of Maintenance, manages the engine removal on a newly acquired aircraft.
Honestly, there aren’t many of us, but that’s changing. There are some old-school mindsets that still exist with some people you come across, but that is no longer the majority. You have to be strong and know you can work just as hard and compete just as equally. However, that outdated mindset certainly isn’t found within ComAv senior management. They fully empower women to succeed in the industry and allow us to choose the path that’s right for us. That said, personally, I have this love for challenges. I tend to select the path that’s going to challenge me the most. Anyone who knows me well enough would agree completely. I knew I wanted to make an impact, that I wanted to achieve things I could be proud of, and that I wanted to be helpful. I get to do that here. That’s something unique in itself and very special to find.
For young women looking at this career field, I say go for it and keep a positive mindset. We need more of us here and we can absolutely make a difference. There are an increasing number of female mechanics and business associates in the industry, and they’re doing an incredible job. My biggest advice is to work hard, be humble, and challenge those limits, strive to learn all that you can within your specific area of interest.
ComAv is a local company here in the High Desert. How do you like working there?
It is incredible. Recently, ComAv was awarded our 14th Diamond Award by the FAA. This award is for training, safety and technical knowledge. The Diamond Award is the highest award you can get from the FAA. Only 5 companies in the world have achieved this at this level. We strive to be a world-class corporation and these show that we are meeting that goal. I am so proud of our accomplishments and continue to watch this company grow and achieve.

The ramp and maintenance lines stay busy at ComAv Technical Services.
Another great aspect is that the job and industry are incredibly stable. The aviation industry is certainly here to stay and will continue to evolve. And the icing on the cake is really the management. Craig Garrick, our CEO, treats us like family. Family comes first. We are encouraged to try different departments to find our passion and strengths. A CEO that opens doors to let employees try things and to dabble in other roles is an incredible thing. And the industry brings me something new to do every day which means every day is interesting and challenging. Finally, we're getting ready to reveal a website that we hope will be a resource for folks to learn how to get into this amazing company and industry.
That does sound incredible. And how do you like the High Desert?
I’ve lived and worked all over the country and I’m not originally from here. The high desert has a great family-oriented, small-town vibe that is absent many other places and California really has so much to offer.
What advice would you give to an individual trying to figure out where to work or who to work for?
Try to learn all aspects of an industry that interests you and be selective about the companies you apply for and their individual culture. ComAv has a wonderful culture that some other organizations may not. Also, ComAv pays for schooling for our employees. That means they are investing in my future and I don’t have to rack up the debt that others may have to. Whether you are interested in maintenance, sales, marketing or finance they empower you to achieve more in your education.
How did you end up in Marketing for ComAv? I know you know a lot about Aviation. Did you have a lot of Marketing experience?
I am in Marketing right now because my skillset lent itself well to that right now. I am also familiar and experienced in the contemporary aspects of marketing for this industry that some may not be. I have vast experience in digital marketing concepts and business, and, paired with my aviation background, I can produce content that resonates well with the industry and our target audiences. Marketing has a special place in my heart and I know my role will continue to evolve. In fact, I’m starting a new role at ComAv this month and hope to continue my challenge of reaching senior management here. Continuous learning is a perpetual component of successful people.

ComAv Technical Services Airframe and Powerplant Technicians lift a Nose Cowl from an engine.
Were you a 4.0 student in high school?
(Laughs) I was a solid B kid in high school. Now, I’m a 4.0 student and was through college. But it’s because I love what I’m doing, what I’m learning, and I’m invested in being successful. I found my passion. I realized just how important education is to this industry.
What do you do for fun, Lisa?
I love to read about other cultures, travel, golf, spending time with my loved ones and my English Springer Spaniels.
And what are you reading right now?
I’m reading two books: Nothing to Envy: Ordinary Lives in North Korea by Barbara Demick and It’s What I Do: A Photographer’s Life of Love and War by Lynsey Addario, a war photographer with an incredible story. I appreciate books that help me widen my perspective of the world and the human condition. They help take me outside of my own experience.
And finally - what's the dream?
I would like to be the CEO of an aviation company some day
Well, Lisa, I thank you for your time. I know you'll be a great CEO some day and I also know your story is going to inspire students around the region.
--
Teachers - Lisa is available and interested in being a guest speaker in your classrooms. If this is something you are interested in, please contact the MDCP office to coordinate.

Now We're Cookin': Meet Chef-in-Training, Ebert Cabrera
I recently met Ebert Cabrera - a sharp and motivated young man with a knack for all things culinary who is not going to let being deaf get in the way of his dreams.

“This is my advice to people: Learn how to cook, try new recipes, learn from your mistakes, be fearless, and above all have fun”

I recently met Ebert Cabrera - a sharp and motivated young man with a knack for all things culinary who is not going to let being deaf get in the way of his dreams.
Ebert, I’m glad to meet you and have the opportunity to capture some of your interesting story. You’re just wrapping up your Junior year at Apple Valley High School. Which CTE program were you involved in this year?
I am in the baking class. I took cooking before this class, but this year I’m in baking. I’ll be in Baking 2 next year.
What motivated you to pick culinary arts as a topic of study?
I want to be a professional chef someday. I knew that this class was going to help me do that.
What kind of chef do you want to be? Is there a particular place or cuisine that interests you?
Right now, I’m interested in everything - all types of foods. I still need to figure that out - to explore my options and what’s out there.
What are the most significant skills or learnings you acquired through this program?
Technical kitchen vocabulary, number one. Also, I learned names and uses of various tools and forms of cutlery. I learned about the types of meat, how to determine freshness of ingredients and when ingredients need to be disposed of, how to properly store product, and all about food temperatures.
Have you used these skills in your daily life?
I am cooking more at home. I learned a lot about cooking from my grandmother when I was younger. She’s a fine cook with a lot of great cultural recipes. Now that I know more, I can better understand and refine the details and the topic has become much more interesting to me.
Is there anything you’d change about your experience in the culinary pathway if you were to go back and do it again?
(Ebert pauses to think and consider) I actually wouldn’t change anything. If I could, I’d take this again and again.
I understand you competed in Skills USA this year. How was that experience?

Working on his dough, Ebert digs deep and relies on the skills he practiced to complete his dishes. While the kitchen was hectic that day, Ebert managed to keep his cool to finish and finish well.
This was my first time competing in something like this. Mrs. Celie asked if I was interested in competing and I agreed to give it a try. Before the regional competition in January, I practiced a lot. I knew I had to make pumpkin bread, a lattice pie crust, sugar cookies and a pie shell within a certain time limit. I kept practicing until I felt confident I could pull it all off within the allowed timeframe. When I went to the regional competition in San Bernardino, we put on our culinary uniforms, reviewed the rules, about cooking area boundaries, and what would result in point deductions. It was a stressful event - at one point all of the ovens were full and I had to wait, the individual in the station next to invaded my workspace with his stuff, and an oven I was using was turned off by another student. Yet, I was able to get everything done and was awarded first place. Because I got first, I competed in the state competition in April. At the state competition in Ontario, I had to bake pumpkin bread and decorate a cake according to specific requirements then bake an apple pie with lattice crust and apple turnover as well as make a pie shell. I was worried that I wouldn’t complete the items in time but managed to pull it off. In fact, I even had enough time to clean my station before time ran out.
That seems like a lot to pull off. Did you have to make these item simultaneously or one at a time?
Items had to be made at the same time. For example, the pie took 30 minutes to bake, so once that was in, I had to focus on something else. My time management skills have been refined through this and that certainly helped.
What’s the best part of the culinary CTE program?
Getting to learn about and make different things. I’m already looking forward to coming back next year to take the 2nd baking class and decorating more cakes.
Have you had any challenges you’ve had to overcome through all of this?
There was a small communication challenge at first, but it wasn’t a big deal. I’ve had a great time here in this program so far. I’ve learned a lot, my teacher, Mrs. Celie, has been very supportive and helpful, and I look forward to learning more with her next year.

Lovin' from the Oven: Itzel Gonzales and her Award-Winning Muffins
Itzel Gonzalez: Baking Talent on the Rise
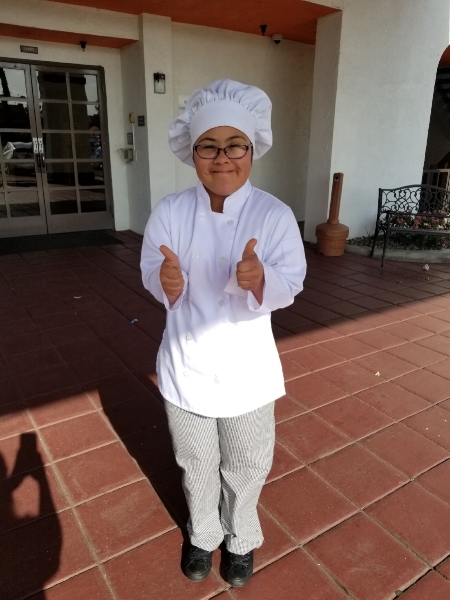
Earlier this week, I had the opportunity to sit down with Itzel Gonzalez, an energetic, well-spoken, passionate young woman happy to share her story and her culinary experience with me during her last week before summer break.
Itzel, it’s such a pleasure meeting you. I understand you are a junior at Apple Valley High School. Can you tell me which CTE program you are in?

Yes. I am in the culinary cooking class.
What motivated you to jump into the culinary arts programs at AVHS?
Well, I really like to bake and cook. I have baked with my mom and dad for a long time and really enjoy working together in the kitchen. And I’ve always enjoyed making blueberry muffins, which are my dad’s favorite. I like to keep trying to get better and better and this class has helped me do that.
I get to work with your mom, Belen Colon, quite a bit. Would you say that you’re a better cook than her now that you’ve been through this class.
(Enthusiastic nod after a glance across the room at her mother) Yes, I think so.
I thought you might be. We won’t tell her. So besides culinary skills, what have you gotten out of this experience?
I had a mock interview recently with the idea of opening my own bakery. The interview went really well because of this class. I like culinary studies. I own it and my family is all really happy for me.
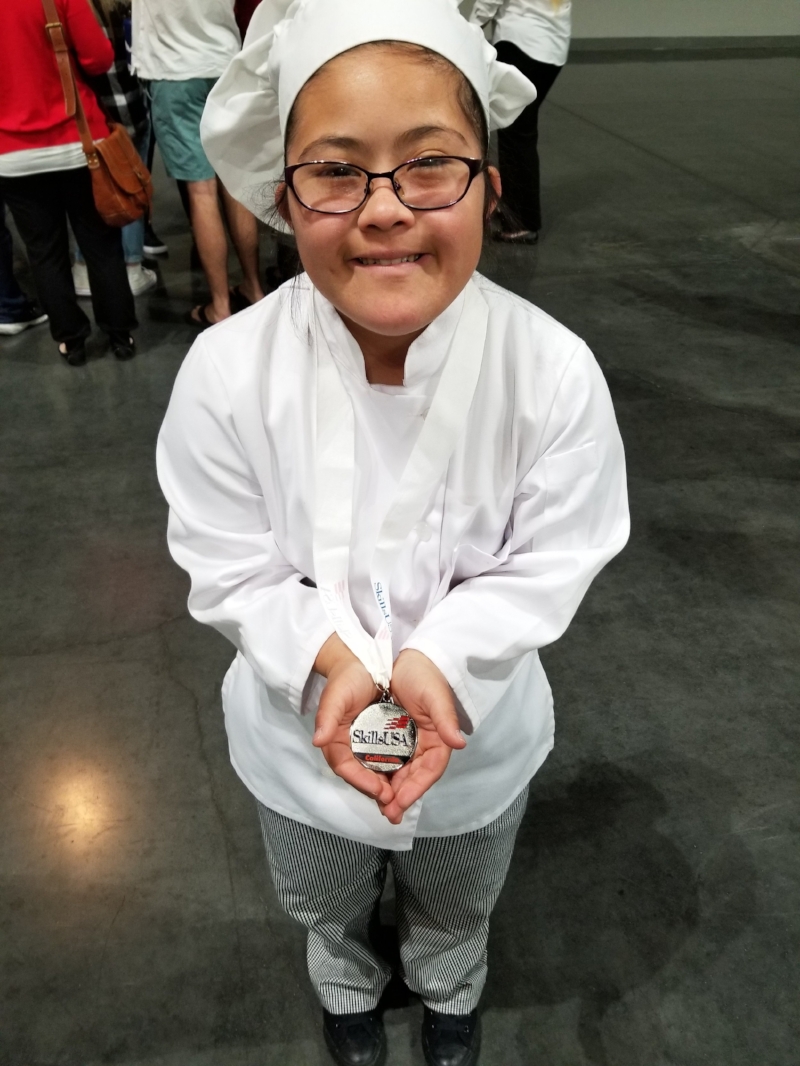
Competing in Skills USA was a blast for Itzel and something she plans on doing again next year.
How have you applied what you’ve learned in CTE to your daily life?
My skills in the kitchen have gotten better and my dad wants to teach me more. He teaches me about steak, lobster, everything. He helps me cook at home and to keep learning and practicing.
Where do you hope this leads? What’s the dream?
I would like to be a baker for my whole family. I have family in Texas and in Boston. I would like to share my food with them. I make really good cookies and muffins.
I bet you do. This interview is giving me a sweet tooth. So I hear you did pretty well at a competition earlier this year. Can you tell me about that?
I competed in Skills USA and demonstrated how to make Blueberry Muffins to a panel of judges. I wasn’t really nervous - I owned my food, was brave, and looked at the judges when it was my turn. I want to do it again! I took 1st place at the regional competition in January and then took 2nd at state in April.
What’s the best part of your CTE program?
I get to learn about cooking and I get to keep practicing. I’m able to show my family and I know they are proud of me. I will be taking more culinary classes next year.
What’s next for you after high school?
I really want to work in a daycare for babies. I know that I could bake for the daycare and I would enjoy helping the little kids.
And what’s next for you after this week? I bet you’re looking forward to summer break.
I am. We are going to travel and have a family reunion. I hope to bake for everyone and will have fun seeing everybody.
What do you think you’ll make for them?
Maybe some blueberry muffins.